Example Of An Outlier In Statistics In The Real World
An outlier in statistics is an observation point that is significantly farther away from the other data points in a dataset. In the real world, outliers are often the results of anomalies or errors in data collection or analysis. For example, in a survey of student test scores, one student might have a score that is significantly higher than the rest of the students in the sample. This student would be considered an outlier and should be investigated further to determine if there were any errors in the data collection or analysis.
What is an Outlier?
An outlier is an observation that appears to deviate drastically from the other data points in a sample. In statistics, an outlier is an observation that is far away from most of the other observations. In the real world, outliers are rarely random and usually indicate some kind of underlying cause, such as a mistake in the data collection process, a mislabeled data point, or a rare event. Although outliers are often seen as troublesome, they can provide valuable insights into a data set. By understanding the cause of the outlier, researchers can gain a better understanding of the underlying phenomena.
When examining a data set for possible outliers, it is important to consider the context and the data points surrounding the outlier. For example, if a data set contains only positive values and one negative value, the negative value could be an outlier. Similarly, if a data set contains a relatively even distribution of values and one unusually large value, the large value could be an outlier.
To understand the impact of an outlier, it is important to consider the type of analysis being performed and the assumptions of the analysis. For example, if a researcher is performing a linear regression analysis, the outlier may have a significant impact on the regression line. In this case, it may be necessary to remove the outlier from the data set or to use a different type of analysis.
In conclusion, an outlier in statistics is an observation that appears to deviate drastically from the other data points in a sample. Outliers in the real world are rarely random and usually indicate some kind of underlying cause. It is important to consider the context and the data points surrounding the outlier to understand the impact of the outlier. By understanding the cause of the outlier, researchers can gain a better understanding of the underlying phenomena.
How to Identify an Outlier
Outliers in statistical data can be tricky to identify, but they’re an important part of data analysis that can provide invaluable insights. An outlier in statistics is an observation that is significantly different from the rest of the data, and they can be the result of mistakes, random fluctuations, or even genuine differences. To identify an outlier, you need to be familiar with the data and its distribution. You should check for any unusual values, look for any patterns that don’t fit the general trend, and examine how the outliers compare to the rest of the data. If the outlier is too far from the mean, it could be an indication that the data point is actually an error.
You can also use statistical tests to help identify outliers. These tests compare the likelihood that a given data point is an outlier against a predetermined level of significance. If the data point is determined to be an outlier with a high level of significance, then it is likely that it is an outlier. Additionally, you should consider the context of the data point when determining its validity. If the data point is from a different population, or if it is an extreme value, it may be an indication that it is a genuine outlier.
Identifying outliers in your data can help you gain a better understanding of the underlying trends, and help you make better decisions based on your data. By being familiar with the data and the methods used to identify them, you can more accurately analyze and interpret your data, allowing you to gain valuable insights into your dataset.
Causes of Outliers
Outliers in statistics refer to data points that are significantly higher or lower than the majority of the rest of the data. This can be caused by a variety of factors, such as errors in measurement or data collection, or naturally occurring events. In the real world, an example of an outlier can be seen in the stock market when a company’s stock prices are significantly higher or lower than the rest of the market.
Outliers can also occur due to large changes in the economic or political environment. For example, a sudden increase in the cost of a commodity can cause the price of the commodity to be an outlier. Additionally, a major natural disaster, such as an earthquake or hurricane, can cause an outlier in the price of goods and services.
Finally, outliers can also be caused by random chance. For example, in a survey of a population, a few people may provide answers that are significantly different than the rest of the population, resulting in an outlier. These outliers can be difficult to detect and should be taken into account when analyzing data.
In conclusion, outliers in statistics can be caused by a variety of factors, including errors in data collection, large changes in the economic or political environment, and random chance. Understanding the causes of outliers can help to ensure that accurate data is collected and analyzed.

Examples of Outliers in Statistics
in the Real World
Outliers in statistics refer to data points that are unusually different from the rest of the data in a given set. In the real world, outliers can have wide-reaching implications, from invalidating the validity of an entire dataset to providing valuable insights that may otherwise have gone unnoticed. To better understand how outliers can affect data analysis, let’s look at some real-world examples.
For instance, consider a study of the effects of a new drug on patients. If the results of the study reveal a few patients who showed extraordinary responses to the drug, those patients could be considered outliers. While it may be tempting to ignore these outliers, it is important to consider their effects on the study. In this case, the results of the study could be drastically different if the outliers were removed from the dataset.
Another example is consumer behavior. In a survey of consumer buying habits, an outlier could be a customer who spends significantly more than the average consumer. This could indicate a shift in the market and signal a need for a business to adjust its marketing strategy.
Finally, in healthcare, outliers can be used to identify rare diseases or illnesses. For example, if a patient’s test results are far outside the norm for a given condition, they may be suffering from a rare disease that requires special attention.
Outliers in statistics can have a profound impact on data analysis, and it is important to consider their effects when analyzing data. By recognizing when an outlier is present, businesses, researchers, and healthcare professionals can gain valuable insights that would otherwise go unnoticed.
Impact of Outliers on Data Analysis
Outliers are values in a data set that drastically differ from the majority of the other values in the set. These extreme values can have a huge impact on the results of data analysis, skewing the data and producing inaccurate results. It is important to identify and address outliers in order to produce reliable, accurate data.
The impact of outliers is especially significant in statistics. Statistics is a branch of mathematics that deals with the collection, analysis, interpretation, and presentation of data. To accurately analyze data, it is important to identify and address any outliers that are present. This is because outliers can significantly affect the results of data analysis. For example, if a data set includes an outlier, the mean or average of the data set will be skewed, rendering the results inaccurate.
In the real world, outliers can be caused by various factors. For instance, they may be due to data entry errors, large changes in the underlying data, or a sample size that is too small. It is important to identify and address these outliers to ensure that the data analysis is accurate and reliable.
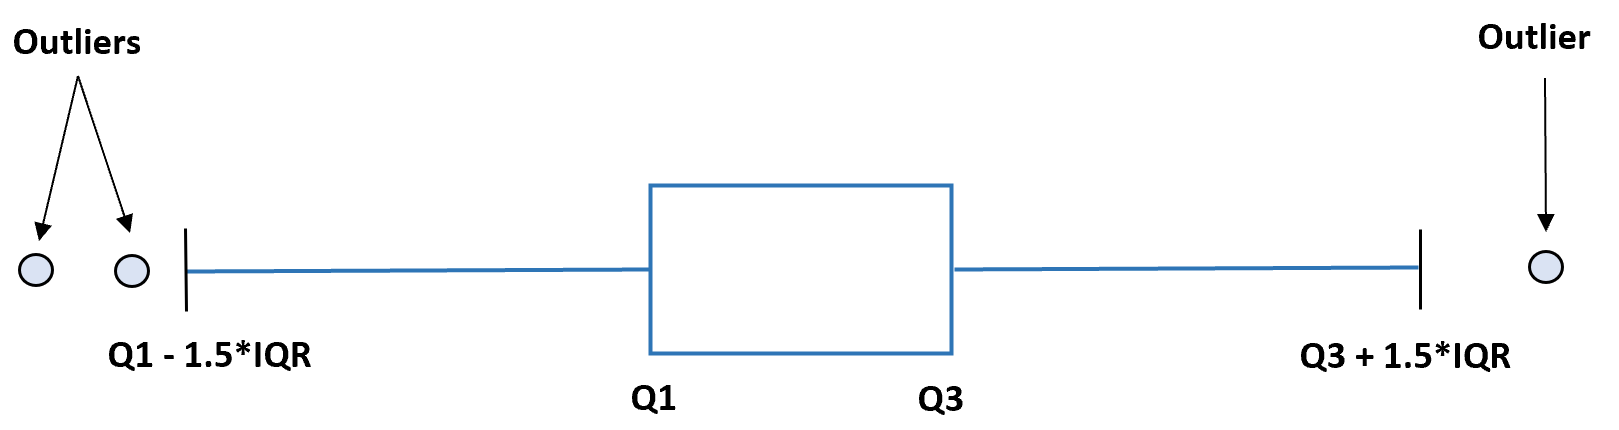
Outliers can be identified through several methods, such as box plots, histograms, scatter plots, and standard deviation. Once an outlier has been identified, it can be addressed in a variety of ways, depending on the type of analysis being conducted. For example, the outlier may be removed from the data set, or weighted differently in order to ensure that the data analysis is accurate.
In conclusion, outliers can have a dramatic impact on data analysis. It is important to identify and address outliers in order to produce reliable, accurate results. By using the various methods of identifying outliers and addressing them appropriately, data analysts can ensure that their data analysis is accurate and reliable.
Strategies to Manage Outliers
Outliers, or data points that lie outside the expected range of values, can be tricky to manage. While they can offer valuable insights, they can also skew results and lead to incorrect interpretations. To ensure accuracy, it’s critical to have strategies for how to deal with outliers. Here are several options:
1. Exclude Outliers: This is the most common approach, particularly when outliers are caused by data entry errors or other problems. Simply removing them from the data set can prevent the results from being skewed.
2. Transform Outliers: Transforming outliers can also be useful when there are multiple outliers, or when the outliers are indicative of a larger issue. For example, logarithmic transformation can be used to reduce the effect of outliers.
3. Analyze Outliers: While it’s important not to include outliers in the main analysis, they can still be used to gain insight into the underlying trends of the data. Looking at the outliers on their own can help identify causes and effects.
4. Model Outliers: Modeling outliers can also be an effective approach, particularly when used in combination with other methods. By using algorithms to identify, analyze, and model outliers in the data, it’s possible to gain greater insight into the underlying patterns and trends.
By implementing these strategies, it’s possible to identify and manage outliers more effectively, and make sure that the results of any analysis are accurate and meaningful.
FAQs About the Example Of An Outlier In Statistics In The Real World
1. What is an example of an outlier in statistics in the real world?
An example of an outlier in statistics in the real world could be a student who scores significantly higher or lower than the rest of the class on a standardized test.
2. How do outliers affect the accuracy of a data set?
Outliers can skew the results of a data set if they are not taken into account. This can lead to unreliable results and inaccurate conclusions.
3. How can outliers be identified in a data set?
Outliers can be identified by looking at the range of data values and identifying those values which lie outside of the range. They can also be identified by looking for values which are significantly higher or lower than the rest of the data points.
Conclusion
An outlier in statistics in the real world is an observation that is located far away from other observations in a data set. Outliers can be caused by measurement errors, sampling errors, or data entry errors. They can also be caused by a true difference in the population being sampled. It is important to identify and understand outliers in order to ensure that the results of data analysis are accurate.